
Pricing to win today with growth levers for tomorrow
- Troy Wendt

- Feb 28, 2019
- 12 min read
Updated: Apr 5, 2023
Pricing. Can we fix that next quarter?
Pricing is often a huge opportunity for incremental revenue growth that is left untouched. Why? Pricing is a complex subject with many pitfalls that impacts product, marketing, operations, sales and finance. Ownership is not obvious, and typically company founders created the initial pricing structure without significant research or revenue history. Further, the installed base of customers is on the current pricing plan, and transition to a new pricing model might be painful.
Future revenue growth is a good reason to roll up the cross-functional sleeves, and tackle pricing strategy for company stakeholders. This article will show the financial effects of successful pricing changes that improve two key growth variables — the rate of new customer revenue acquisition and existing customer revenue retention.
First, revenue acquisition. New ARR is a key sales performance metric because it measures brand new customers in the door. These new customers will continue to deliver revenue as long as they stay. Specifically this article will investigate the impact of the growth in total annualized new ARR each quarter. The second key growth variable considered is net retention, which measures the change in total recurring revenue from a cohort of existing customers. Net retention includes the accretive effects of price increases, upgrades and cross-sells, and also the erosion from downgrades and churn. Given that companies will eventually lose some customers, it is ideal to strategically design increased revenue from remaining customers to compensate. Together, improved revenue acquisition and revenue retention can dramatically impact annual revenue growth and company valuation.
Let’s dig into the numbers for a hypothetical company getting to traction. To illustrate multi-year financial impact, this post uses a growth model (link to spreadsheet) for a sample company we can call SampleCo. SampleCo exited Q4 of last year at $10M in ARR (Annual Recurring Revenue) with $3M of that New ARR in Q4. SampleCo has achieved product market fit, and finally sales can close big deals relatively fast with reference customers and a value proposition that resonates. Bookings are ramping, and for the first time our CEO told the board SampleCo achieved calendar year revenue and ARR goals.

Pricing to Win Today
SampleCo’s sales results from last quarter in terms of New ARR and quarter end Total Company ARR are both entered into the pricing growth model:

The model uses cohort analysis of recurring revenue, which means we will track the cumulative revenue of the group of customers acquired in each quarter over time. For ease of use and illustration, all previously existing customers are grouped into a single cohort called All Prior Cohort ARR, which is calculated above. With our baseline established, we are all set to vary the two input variables that drive scenario outputs, New ARR Q-Q Growth set at a baseline value of 5% and Quarterly Net Revenue Retention baselined at 95%. The model calculates the resulting revenue of our company for the next 3 years in Scenario #1:

In Scenario #1, our company ARR rises from $10M to $45M over the next 12 quarters or 3 years. In Scenario #2, we assume our new pricing strategy improvements are able to increase New ARR Q-Q Growth from 5% to 10%. What happens to our SaaS company's key revenue performance metric, company ARR, over 3 years with this increase in new customer acquisition? Resulting company ARR increases from $45.0M to $62.6M as illustrated graphically by cohort in the charts below:

Obviously the CEO and leaders in product, marketing, operations, sales and finance would prefer the scenario on the right, but how can they work together to create pricing changes that improve customer acquisition measured in dollars? Key factors in optimizing a pricing strategy include:
A deep understanding of benefits of current product features and future roadmap
Data to segment customers by their perceived value to target product offerings
Willingness to pay for features, bundles and/or solutions by customer segment
Marketing considerations that influence demand generation
Operational limitations and opportunities to sell differentiated product offerings at scale
The competitive landscape or a model of new market creation
Sales input from the front lines to understand how they can use an intelligently priced portfolio of products to win the right customers, then extract their budgets
A structured decision process
Pricing architecture decisions could include usage-based vs. discrete offerings, Freemium or not, add-ons or not, user-based or not, Good-Better-Best, foundational bundled features, next level bundled features & value-based metrics that drive upgrades.
Pricing Strategy Example #1: Improving New ARR with Segmentation
The 5% growth rate of new customer revenue is disappointing to both our VP of Sales and CEO at SampleCo, our hypothetical SaaS startup. The VP of Sales has a key performance metric tied to 10% quarterly New ARR growth. They called upon the newly hired head of growth to investigate.
The story in the data is as follows:
Average quarterly growth rate of New ARR over the last 4 quarters is 5%
Recent segmentation project using data science techniques revealed that our customers fall into three distinct segments: Segment 1, Segment 2 and Segment 3
Win rates for Segment #1 are extremely low relative to other segments
Last months’ willingness to pay (WTP) survey showed that optimal pricing for Segment 1 is much lower than current pricing
Segment 2 is centered in the ideal price range based on WTP research
Optimal WTP-based pricing for Segment 3 is about twice current pricing levels
Feature usage data from the product team indicates 3 key features with 95%+ usage rates by Segment 2 customers, and minimal usage by Segment 1
Feature usage data also indicates there are 3 features with 97%+ usage by Segment 3, with less than 5% usage by Segments #1 and #2
Segment 3 customers and prospects in our marketing database are mostly large enterprise customers
Current pricing plans are called Starter, Premium and Professional
Starter has basic features, and has a very small percentage of Segment 2 and 3 customers
The key features identified for Segments 2 and 3 are only available in the Professional plan
Product management and engineering are about to deliver 10 new valuable features in the next release before our new pricing is announced
Product, marketing, operations and sales are comfortable with the current pricing architecture which looks like:

Additional details around the process and analysis to arrive at a new pricing model will be explained in future posts. We’ll fast forward to the new pricing model collaboratively developed by the cross-functional pricing team at SampleCo:
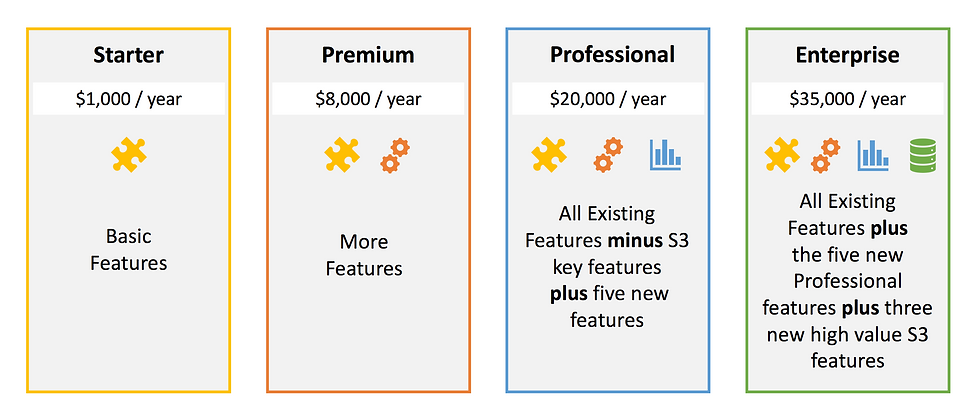
The biggest pain point of this new pricing model is that we are taking away 3 features from the Professional package, but keeping the price at $20,000. Since these features have high importance to Segment 3 but low usage in the other segments, Segment 3 customers are our biggest concern. Importantly we are adding 5 great new features to Professional as the others are removed and made available in Enterprise only.
Subscriptions at Professional level are all annual, and in the pricing meetings we agreed that customers will get the option of a free upgrade to Enterprise when it is launched with one grandfathered annual renewal at the old price of $20k. The goal of this program is to prevent customer churn due to the pricing change. Over the next 12 months significant new features highly valuable to Segment 3 will be developed exclusively for the Enterprise package. For new Segment 3 customers, our VP of Sales is quite confident that she can sell the new $35,000 Enterprise package to most of them. As product management and engineering develop new features over time, they will be selectively added to Starter, Premium, Professional and Enterprise, optimizing on competitive pressure, customer retention, and incentives to choose higher plans.
As this is a fictional story, this new pricing model will precisely increase our New ARR Q-Q Growth from 5% to 10%. What is the math behind this assertion?
New ARR = S1_Customers * S1_ASP + S2_Customers * S2_ASP * S3_Customers * S3_ASP, where the customer variables represent new net customers in the quarter, and ASP is the Average Selling Price by segment in the quarter.
Segment 1: Segment 1 new customer counts were extremely low because pricing was generally above willingness to pay. All Segment 1 customers buy the Starter bundle, for mathematical simplicity. S1_ASP drops from $3k to $1k with our new pricing. If S1_Customers tripled we would be revenue neutral, but S1_Customers increased by 10x. Thus Segment 1 New ARR = S1_Customers * S1_ASP increases.
Segment 2: We’ll assume that Segment 2 customers like their existing pricing, and that few will be bothered by the three features that disappeared in the Professional package. Perhaps we’ll lose one deal, but some new Segment 2 customers will purchase the new $35,000 Enterprise package, because some customers always buy the best, and our sales team is exceptional. One lost customer, but ASP rises to more than compensate. New ARR for Segment 2 increases slightly.
Segment 3: This price inelastic group with a willingness to pay roughly double our old pricing could see a slight decline in new customers, but the killer new features will help sales close a few deals stuck in pipeline. Assume S3_Customers unchanged. But S3_ASP increases as their product mix includes a large percentage of new $35k Enterprise plans. The price sensitive Segment 3 customers can still choose $20k Professional with three missing features. Segment 3 New ARR = S3_Customers * S3_ASP increases.
We’ll assume the mix of S1, S2 and S3 customers and their changes in plan choice is such that New Q-Q ARR Growth rises from 5% to 10%. An additional assumption is that sales and marketing efficiencies will improve with better pricing to maintain 10% quarterly growth in new customer ARR. Thus our new pricing strategy for SampleCo has achieved the growth objectives of our CEO and VP of Sales.
Growth Levers for Tomorrow
Returning to our pricing growth model for SampleCo, assuming we have optimized our pricing strategy to achieve our objective of 10% quarterly growth in New ARR, how can we affect the revenue retention of our existing customers? From a modeling perspective, our existing customers are grouped into cohorts based on the quarter they were acquired, and our baseline quarterly revenue retention was 95%. This means we lose 5% of each cohort revenue stream every quarter, and annual churn = 1 - (0.95)^4 = 18.5%. The second of two key metrics for our modeled pricing strategy is Quarterly Net Revenue Retention.
We are going to swing for the fences, and set our sights on the pricing nirvana of positive retention, also known as "negative revenue churn" or “negative net churn”. This means that although a cohort of customers has logo churn, losing some number of customers, the increased revenue of remaining customers more than makes up for lost customers such that cohort ARR increases over time.
In Scenario #3, we maintain the 10% New ARR growth of Scenario #2, and increase Quarterly Net Revenue Retention from 95% to 105%. Both scenarios start at $10M in total company ARR, but end of year 3 ARR increases from $62.6M to $106.6M.

Graphically, as cohort revenue grows instead of shrinks, the ARR growth curve becomes far more exponential, and we have built an extraordinary revenue generation machine:

How do we craft a pricing strategy that drives expansion revenue of existing customers to deliver positive retention and truly exponential growth?
In his excellent article about scalable pricing, David Skok, five-time entrepreneur and VC at Matrix Partners, says "an important factor to look for in selecting a pricing axis is to look for ways to automatically get more and more revenue from that customer base." As your customers go down the path of increasing usage of your product in various dimensions, a thoughtfully designed pricing structure will appropriately tariff the increase in perceived value. From an economic utility perspective, if the additional payment is less than additional value, customer satisfaction is increased as they pay more.
A key aspect of pricing design for low friction per-customer revenue increase is the selection of pricing axes, the dimensions of price. For SaaS products in particular, pricing is tightly coupled with product features. And our solution set of feature combinations could have millions of possibilities or even more. 100 items that can be structured in groups ranging in size from 1 to 100 has 1.26765 x 10^30 combinations. Thirty is a lot of zeros for a number.
But features do combine naturally into groups that meet the needs of different customer segments. The simplest approach is all 100 features for one price. But selling the same thing at the same price to all customers rarely optimizes revenue and growth. Features should be logically grouped to target customer segments, both for winning those customers initially, and optimizing customer revenue over time. Not all feature groups have explicit pricing - just those that align with significant value. This is a hard problem best solved with a cross-functional team, a proven process, and perhaps some market research.
Pricing Strategy Example #2: Improving Net Retention with Value-Based Upgrades and Add-Ons
Our CMO has been exceeding MQL, pipeline and attributed revenue goals, but would like to see those hard-won customers grow rather than waste away at the current 18.5% annual revenue-based churn. Our current 95% quarterly revenue retention results in an 18.5% revenue loss annually that compounds each year. He took the lead in our pricing committee spearheading a pricing strategy to improve retention.
Data from the growth team was the starting point for strategy development:
Two new features in the next software release both have off-the-charts willingness to pay, but are relevant to less than 20% of our customer base
The growth team’s 6-month value metric project has identified a statistically significant metric that aligns exceptionally with perceived value of Segment 1, Segment 2 and Segment 3
Results are in from the study designed to find optimal trigger points in the value metric for automatic (a.k.a. forced) upgrades between pricing tiers
The mechanics and process of value metric identification and add-on pricing design are meaty enough for two future blog posts.
In summary, a value metric is something measurable that aligns tightly with customer value. Sometimes the best metric for pricing is a proxy for the actual value metric because pricing to the direct metric causes adverse customer behavior. In our new retention pricing strategy, the value metric will be used to force upgrades to the next pricing tier at certain thresholds. These upgrades increase the annual contract value for existing customers.
An overview of the pricing theory for add-ons is that a feature with high willingness to pay that is relevant for a smaller subset of customers is a good candidate for add-on pricing. An add-on is an à la carte item independent of pricing tier. A critical point is that an add-on can be purchased by all existing customers, thereby increasing their annualized revenue contribution. Here is the final pricing strategy approved by the pricing team to improve net retention:
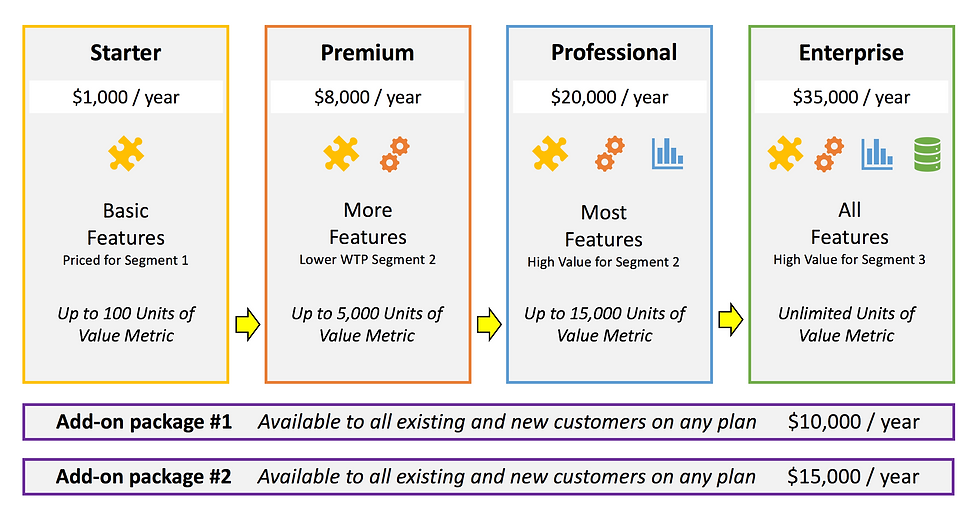
There are countless combinations of feature groupings and pricing architectures to increase net retention, but the key is a thoughtful pricing strategy that moves the metric of increasing ARR for existing customers.
If we more than offset lost customers dollars with revenue increases for remaining customers, we achieve positive net retention. In the case of SampleCo, we assume that our data-driven changes to our pricing with add-ons and value metric automatic upgrades will increase Quarterly Net Revenue Retention from 95% to 105%. A significant benefit of this new pricing architecture is that future features can now be productized as add-ons, creating more opportunity for upsell into the installed base.
ARR Growth and Company Valuation
SampleCo, our hypothetical high growth SaaS company exited last year at $10M in ARR, a huge achievement. But small changes in our two growth variables result in vastly different outcomes over 3 years -- great, extraordinary and unbelievably epic. Our baseline case yields $45.0M in 2021 exit ARR, which would be a great outcome. Moving the rate of increase for New Quarterly ARR from 5% to 10% leads to $62.6M in the same 3 years. Adding a second improvement by raising net retention up from 95% to 105% yields the unbelievably epic outcome of $106.6M in ARR. This is the stuff that SaaS conference titles are made of. David Skok's inaugural growth conference in San Francisco last year was called "Zero to 100". The table below shows the year ending scenario ARR for 3 years. The dollar change in the final year is strongly impacted by improvements in our two growth metrics.

The annualized growth rates are below. A decrease in the annual rate of growth for revenues above $20M is still a healthy pattern for enterprise B2B.

Next, compound annual growth rate, or CAGR. This is the same as an effective average annual return on a financial investment. Starting at $10M in ARR, the CAGR numbers below are in accordance with Scenario #1, #2 and #3 monikers -- great, extraordinary and unbelievably epic, respectively.

As this article was coming along, I became rather interested in building company valuation calculations into the SampleCo spreadsheet. Thank Google, I found a thoughtful and deeply data-driven article written by Alex Clayton of Spark Capital: How much is your SaaS company worth? with an associated spreadsheet. This valuation model specifically uses revenue and growth data from publicly traded high growth SaaS companies: Salesforce, ServiceNow, Workday, Shopify, Atlassian, Veeva Systems, Zendesk, HubSpot, MuleSoft, Okta, New Relic, Box, Twilio, BlackLine, Alteryx, MongoDB, and SendGrid.
Alex's model makes 16 different high growth SaaS company valuation calculations over time, but I took the liberty of extracting the formula for the "Growth Adjusted ARR-based implied company valuation using median comps". The final answer: High Growth SaaS Company-Valuation-End-of-2021 = End-of-2020_ARR * 2-Year_CAGR * 29.055. Using this data-driven valuation model and our hypothetical company with $10M baseline ARR, improving customer acquisition took company valuation 3 years out from $442M to $763M. A second improvement in customer retention raised SampleCo's valuation to $1.59B.

Pricing is indeed hard, but so often an untapped growth lever. For a venture-backed B2B SaaS company with stock-option holding employees working their tails off for years, investors in deep for many millions of dollars, and customers depending on your product -- the stakes are high. Taking on the fight of developing a winning pricing strategy can dramatically increase revenues while also driving up the revenue multiple for valuation. This one-two punch of ARR growth and a high revenue multiple just might deliver the billion $ company of dreams. In SampleCo's case, we got a Unicorn and a half.
The SampleCo growth model used to generate the charts and graphs in this post is available as a Google Sheet. The model can be used to run ARR growth and future valuation scenarios for your company if you input Last Quarter Ending Total Company ARR and New ARR.


Comments